A year you can check
The county tax roll has a year for most buildings, and it is wrong more often than I expected. It says the Driskill Hotel was built in 1930. The hotel opened in 1886. A renovation can overwrite the original year, and condos are often recorded up to three years before they are finished.
So a pipeline compares the tax roll with city permits, UT's building directory, Wikipedia and Wikidata, and I checked the landmarks by hand. Each card names the source of its year.
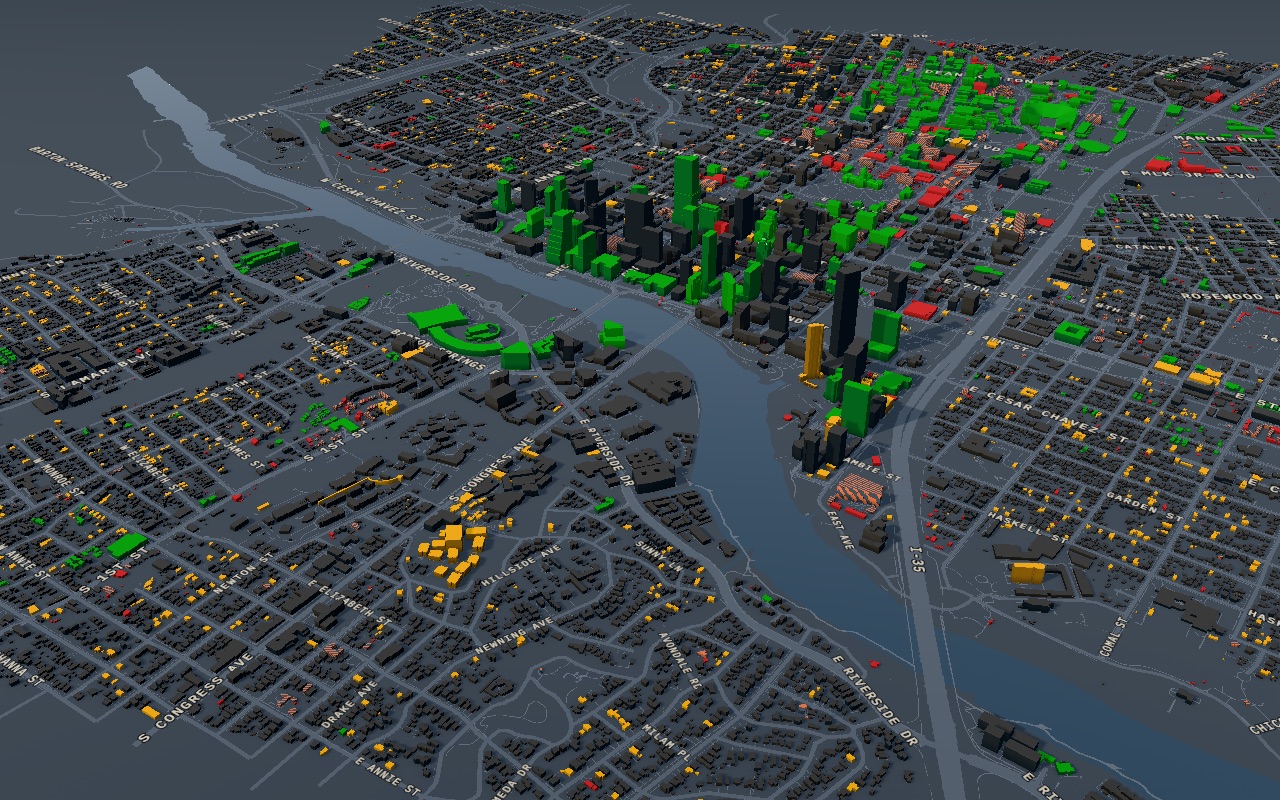
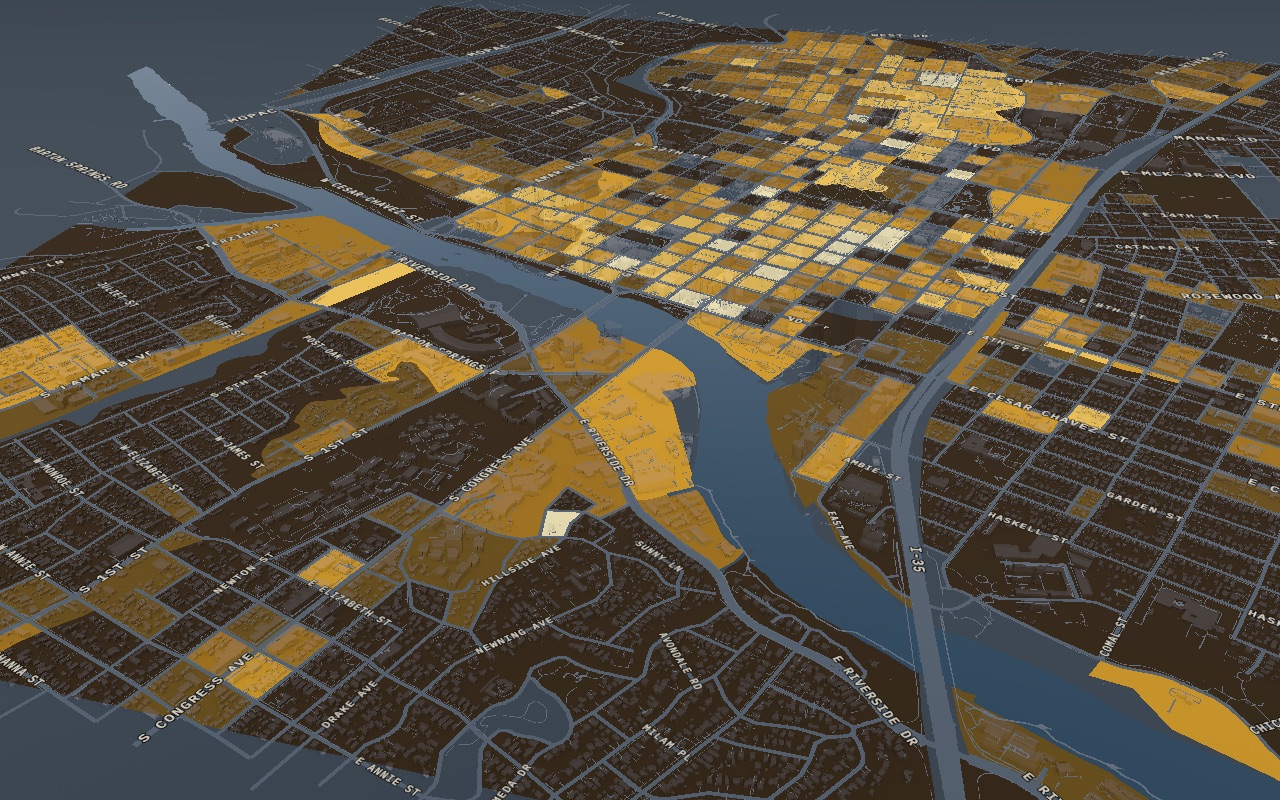
For 379 buildings no source gives a year, but their outlines are already on the city's 1987 map. Their cards say "stood by 1987", and the map doesn't guess. One mode colors buildings by how certain their years are.
Layers, a timeline and tours
The interface grew with every layer until it was hard to read. I rebuilt it around three things. Layers set what you look at. The timeline sets the year. A tour tells one story.
I asked one question about each layer: what can someone learn here by looking? That is why the buildings go dark when you turn on a layer with its own data, such as people or land value. On a phone, the panel folds into the legend so the map gets the whole screen.
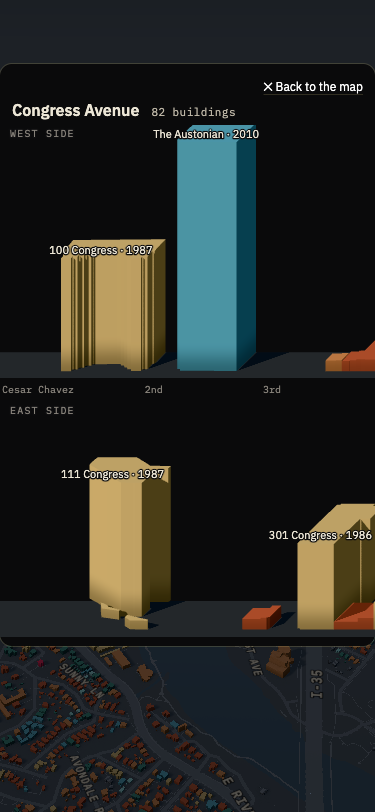
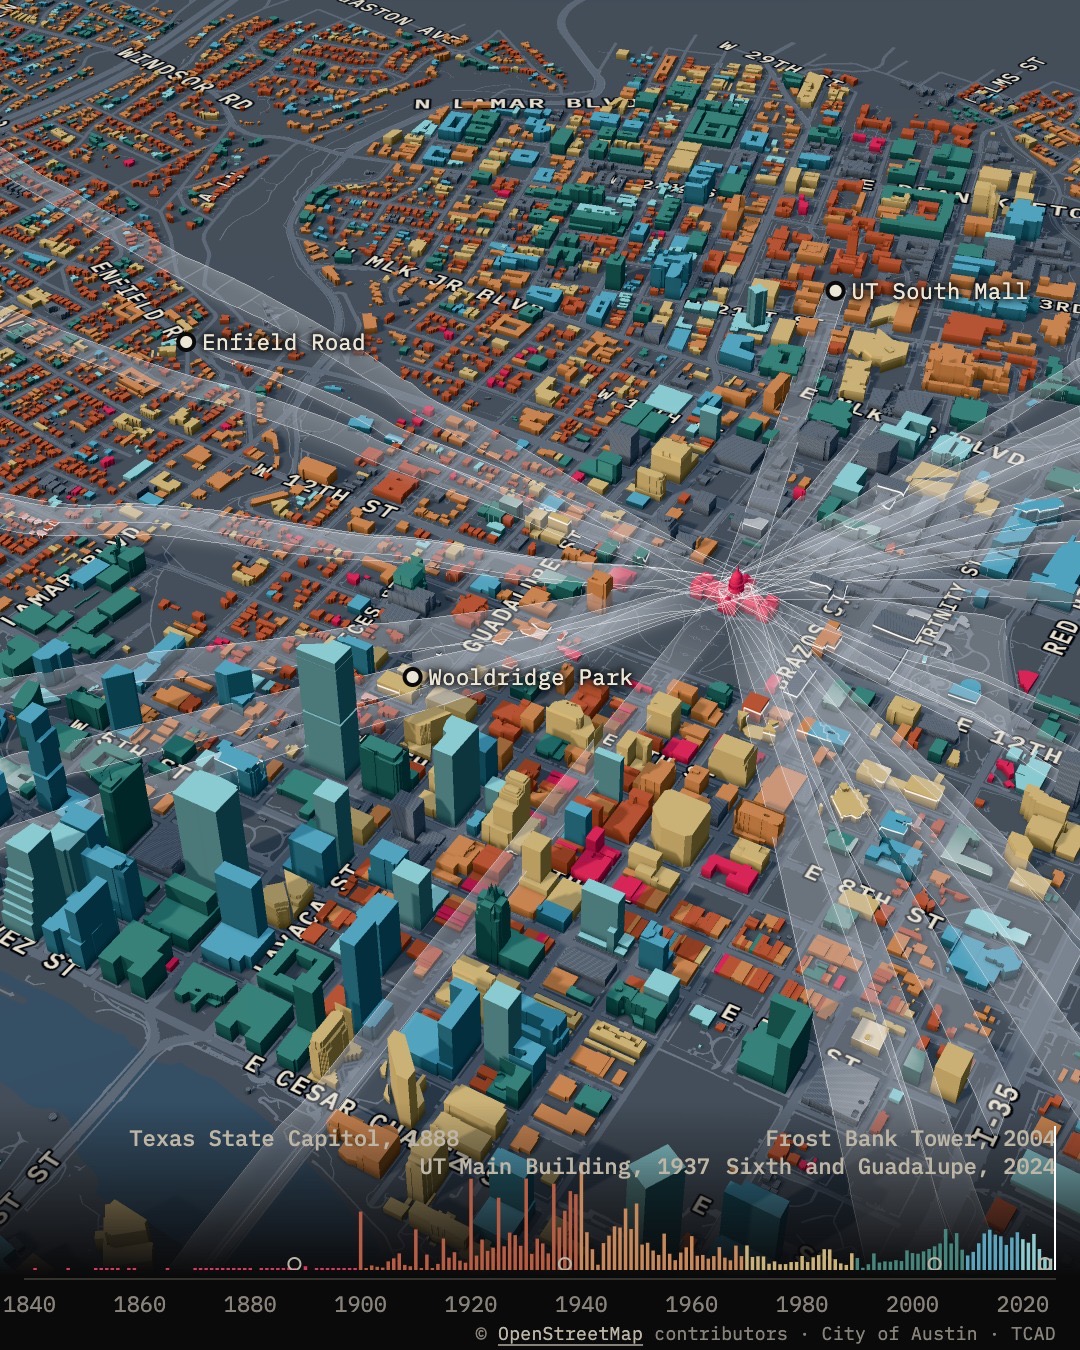
A tour tells history in short facts. Each scene gives one fact and moves the camera to the place where it happened. Click a street and its buildings line up in two rows, one for each side, in the order you would walk past them.
The people layer is a model of one week in fall 2021. No dataset counts people in a single building, so it works by census block, and fall 2021 is the only period when the census, job counts, transit, scooter and parking data overlap. The city's tree inventory covers only city land, so the trees on the Capitol grounds and the UT campus come from OpenStreetMap.
I left a heat layer off the map. The city's "Urban Heat Island" raster is built from classes of ground cover, with no temperatures in it, so it would repeat the trees and pavement. NOAA's Heat Watch did measure the air, but only on August 7, 2020, and only east of I-35, about a fifth of the map. The readings there range from 75.5 to 77.7 °F. That is too little to compare downtown with the old neighborhoods.
The height was right, the shape was wrong
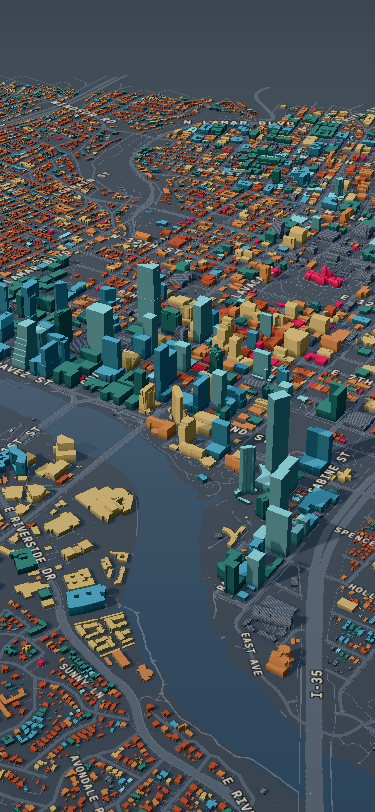
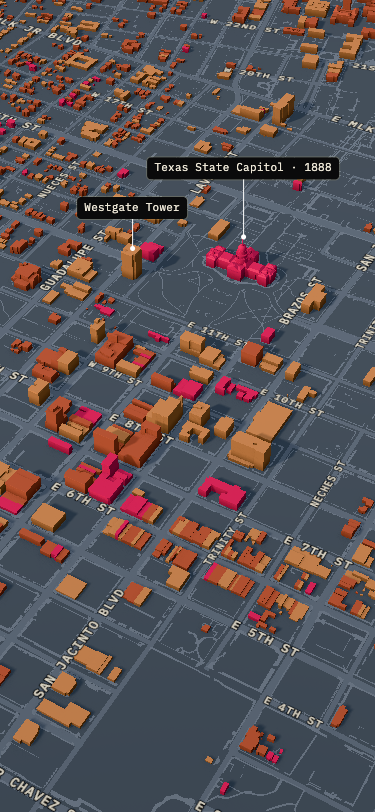
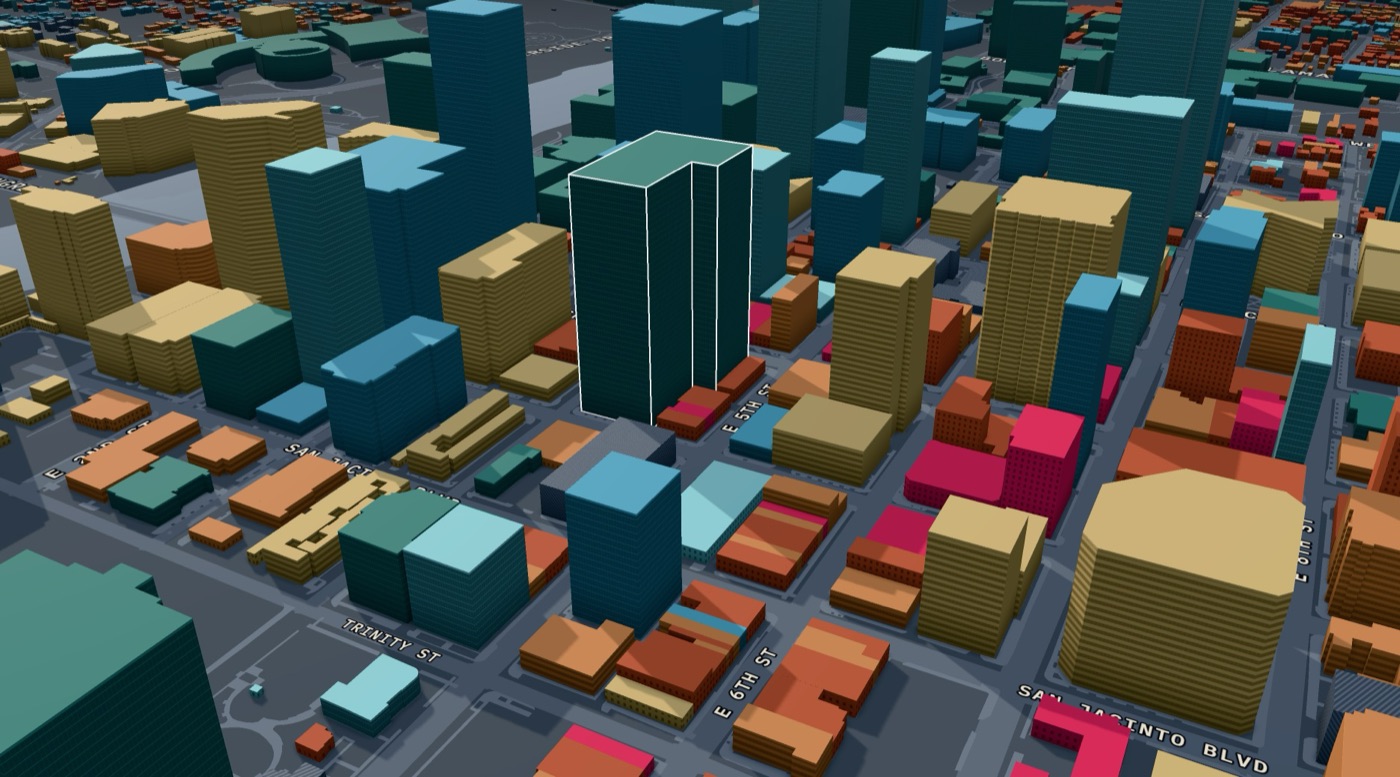
City data gives each outline one height: the highest point the lidar sees over it. UT's Main Building is four stories with a 307-foot tower. On the map it was one box as tall as the tower. Frost Bank Tower was a 515-foot block over its whole lot.
I replaced the boxes with more accurate shapes. They come from building parts in OpenStreetMap, roof tiers cut from the lidar, and six landmarks drawn by hand.
A law you can't see
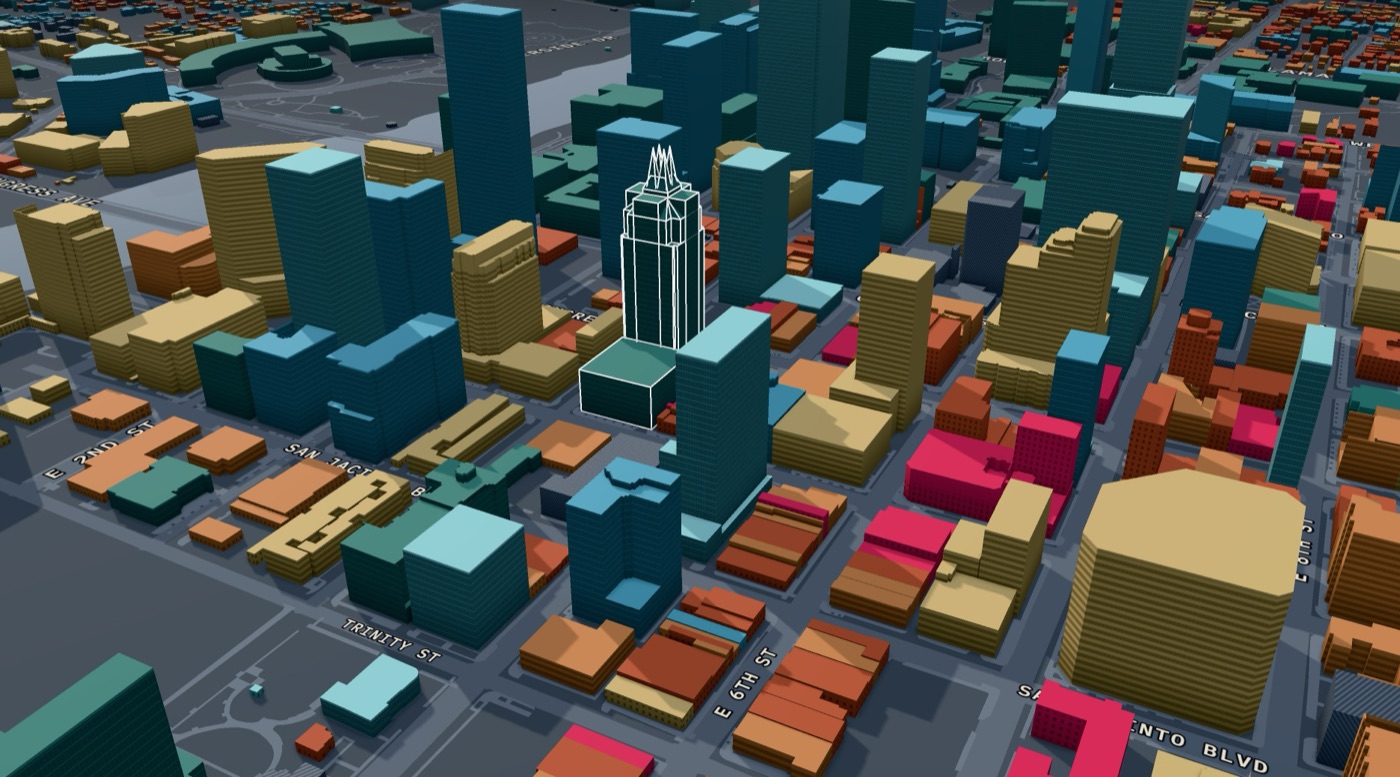
Texas law protects views of the Capitol dome. They are called Capitol View Corridors: 30 when the law passed in 1983, 26 today. No building may rise into them.
I drew the corridors in 3D over the city. Frost Bank Tower steps back 26 feet from Congress Avenue, right where a corridor passes. I haven't seen that written down anywhere, so the map shows it and doesn't claim it is the reason.
The opening
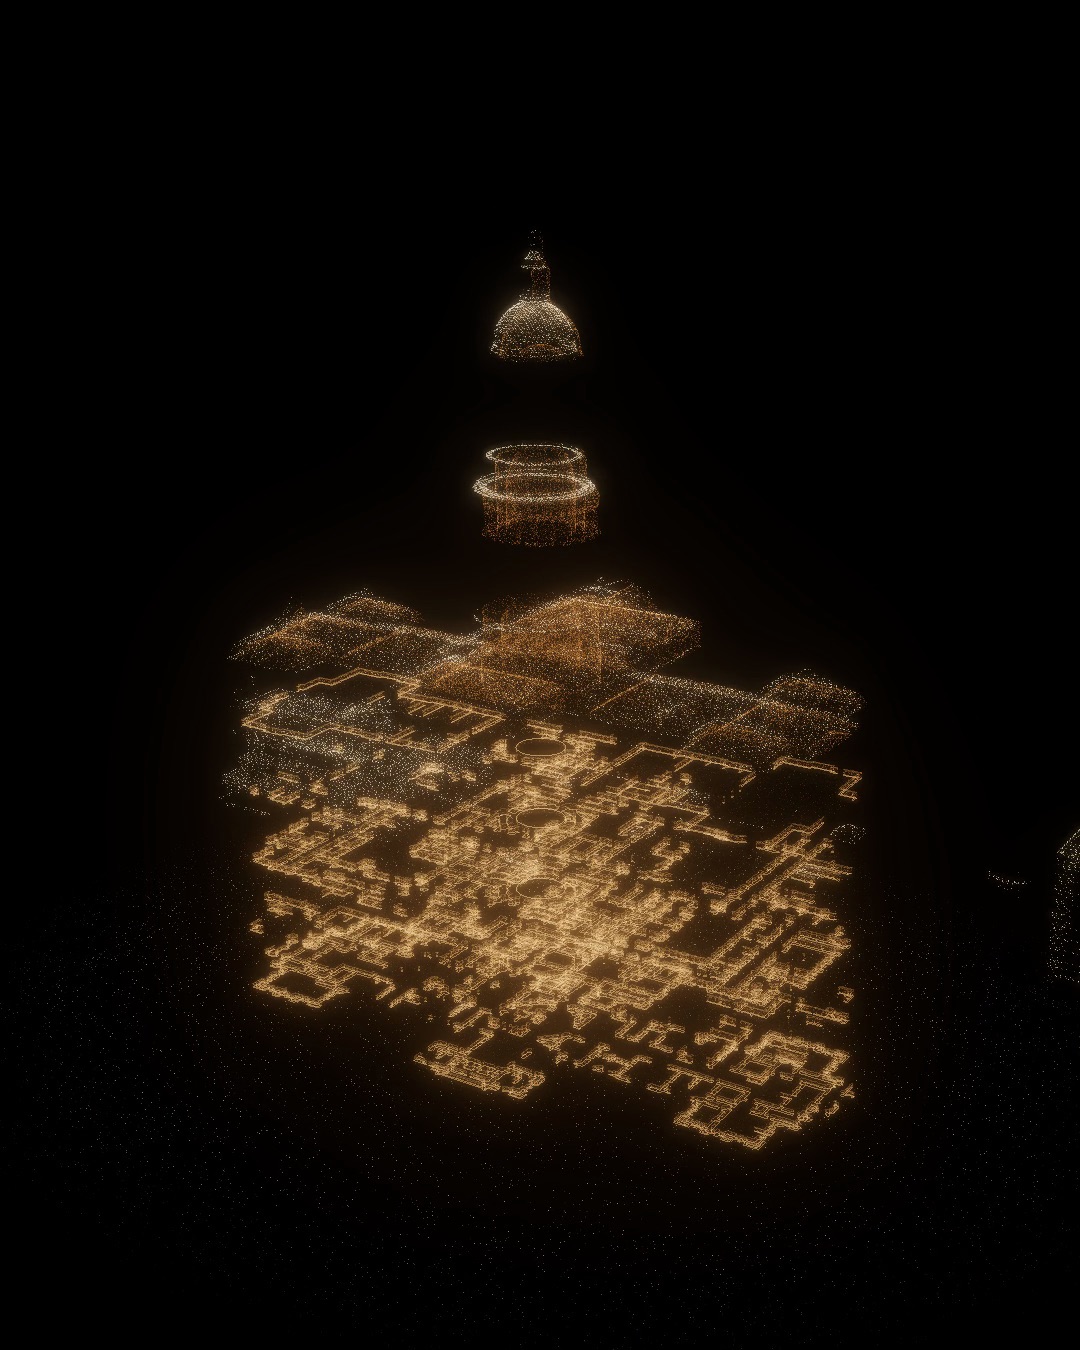
I couldn't find an open 3D scan of the Texas Capitol, so I rebuilt it from 79 sheets of survey drawings made in 1988. The Library of Congress keeps them in the public domain.
When the map loads, the floors spread apart and come back together into the model the map uses. I used the opening to show that the map is built from records.
AI guessed, I doubted, a person checked
An AI research summary told me Austin bought its moonlight towers second-hand from Detroit. It is a popular story. An article by Bruce Hunt, a historian at UT Austin, shows the towers were bought new from Fort Wayne.
Later two sources gave different dates for the tower in Zilker Park. I wrote to him, and he confirmed the chain of moves that the tour now shows.
The tour "What Austin lost" lays a 1922 Sanborn fire insurance map over today's city. It covers segregation, the interstate and urban renewal. Two people who live here read it. One stopped at a sentence she couldn't follow, and I rewrote it. The other asked where the Mexican American families were, and I added them, with sources.
How it's built
The map runs on three.js. The geometry is built once. Changing the year or mode sends a few numbers to the shaders, and a new frame is drawn only when something changes. The buildings are about 2 MB of data over the network.
I started on MapLibre and moved to three.js when I needed my own lighting, the landmarks and the opening. The move took three days. The 3D view talks to the rest of the app only through camera positions and building IDs, so the interface and the tours didn't change.
I wrote the code with Claude Code. I set the structure, the rules for which source wins, and what the tests must protect. A year I checked by hand beats the tax roll and permits. UT's own directory beats the Wikipedia list. A documented year beats everything. There are 172 unit tests and about 270 checks in a real browser. They cover the timeline, the cards, links, tours and the phone layout.